Analyse sales centrally
You can view revenue alongside till sessions. The period, item and location help put the figures into context.
Analytics & operations
Use sales and stock data to manage operations. RIDE adds retail intelligence, while NENGŌ helps you monitor and manage your IT infrastructure.
Business management and technical operations.
SEE HOW THE FIGURES FIT TOGETHER
Sales and item reports help explain trends in your business. NENGŌ adds a view of your technical infrastructure.
Capture the status of connected devices.
Review alerts in the context of operations.
Clarify the impact and who is responsible.
Carry out authorised service actions.
FROM OVERVIEW TO DETAIL
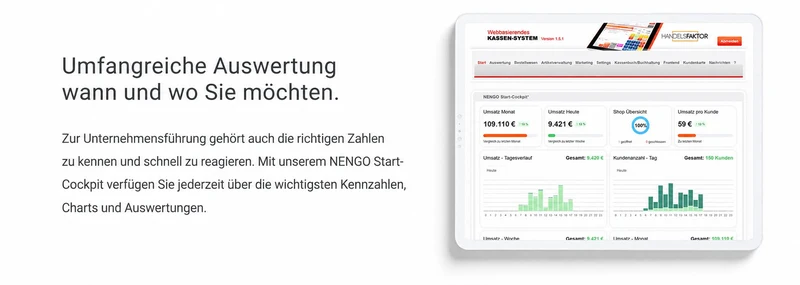
Review sales trends, customer numbers and product ranges together. The management dashboard highlights developments and helps you examine specific periods and locations.
For store managersPut daily trends in context and investigate unusual activity.
For head officeCompare periods, locations and product groups using a common dataset.
Tailored to your roleAgree on the necessary metrics, filters and permissions.
IN EVERYDAY USE
Sales and stock figures show how the business is performing. Device and operating data show whether the infrastructure is supporting it. HANDELSFAKTOR combines reporting with the capabilities of RIDE and NENGŌ.
You can view revenue alongside till sessions. The period, item and location help put the figures into context.
Item trends and best- and worst-seller reports help you identify and investigate changes in sales.
Stock movements and inventory data complement the sales figures. This helps teams investigate practical questions about purchasing and store supply.
The Retail Intelligence & Decision Engine combines data in context with analyses, scenarios and recommendations that teams can trace. Decision-makers retain control.
Tills, printers, networks and other devices are monitored in operation. Monitoring and controlled actions help the support team.
Store managers, head office and IT need different views. Data access and responsibilities are organised accordingly.
HOW IT FITS TOGETHER
Use sales, stock or device data from connected processes.
Compare locations and time periods in their business context.
Review anomalies and approve the appropriate action.
Track changes and their effects during ongoing operations.
A RETAIL EXAMPLE
A store shows an unusual trend. Sales data helps narrow it down to particular items and periods. Operational information can show whether a technical fault played a part. Business analysis and infrastructure monitoring remain distinct.
Discuss your use caseOUR PRODUCTS
Cash movements, daily closing and subsequent accounting belong together. The cashbook helps you handle these processes systematically.
INFRASTRUCTURE & OPERATIONSNENGŌ records and monitors the entire POS infrastructure. It brings together PCs, POS systems, networks, printers and connected peripherals across locations for monitoring, servicing and controlled interventions.
RETAIL INTELLIGENCERIDE connects market intelligence, comparable product data and AI-assisted analysis. Purchasing, pricing and category management teams get options they can trace, with clear approvals and a phased introduction into your existing systems.
YOUR QUESTIONS
RELATED POS MODULES
Sell-through analysis answers questions about the range. Checking payments helps reconcile a till session. Choose the report that fits your store’s question.
THE NEXT STEP
Tell us what you need. We will show you what HANDELSFAKTOR can do for your retail business.
Request a demoAre you planning to switch systems?